Custom status screen
How I built a status screen using a Raspberry Pi and custom Python code.
Tags: homelab python javascriptPosted on: 2026-05-26
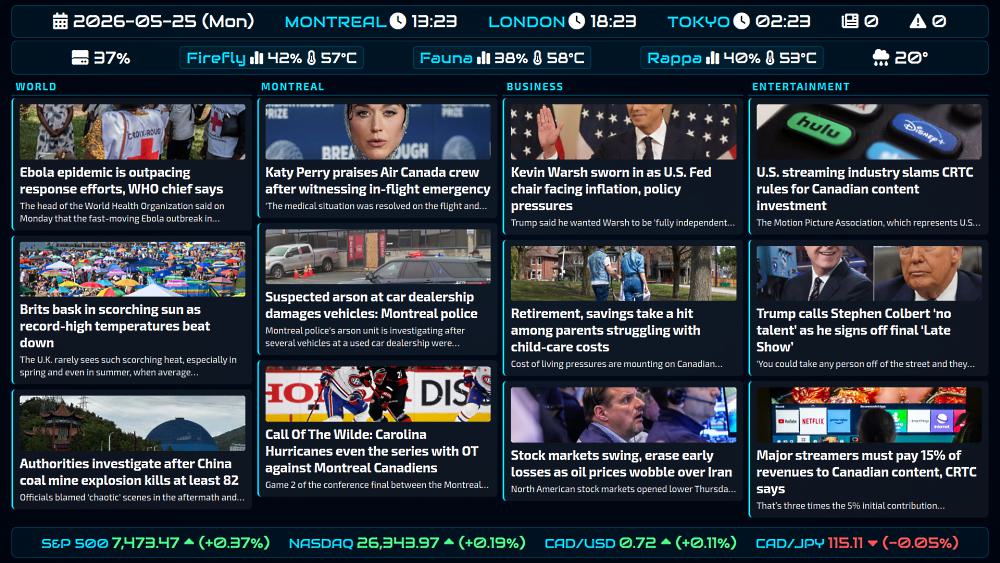
If you've read some of my previous posts, it's not going to come as a surprise that I like to create custom solutions, personal projects, and play with system designs. So when I found myself with a spare 19" TV and a free Raspberry Pi 3B a couple of years ago, it didn't take me long to come up with a plan on how to use them. The premise was simple: having a status screen on my wall that would display the news, stocks, the current weather forecast, the time and date, along with various high level information about my home lab. After several iterations and a percent UI redesign, I present the current day status screen that I use:
The architecture
In this post, I'll go over the architecture and some of the design choices so you can decide whether this is a project that sounds worthwhile for you. Note that I can't really provide a fully working app because the code I built is highly customized for my own situation. For example, it fetches values from my Proxmox cluster, my NAS, RSS feeds, and even from the automation engine I use, Directus, to know how many notifications I have from my system logs. I'm sure there are fully built solutions out there which would be easy to deploy but less customizable. So for now I'll just go over the architecture and give you the main parts.
The overall design is fairly simple:
- The TV: The status screen itself is a simple TV, plugged through an HDMI cable on the Raspberry Pi, running a base Raspbian image.
- The brain: The Raspberry Pi runs Chromium in kiosk mode, which loads data using JavaScript from localhost, along with a Python script that fetches things like the news, weather and stocks data from public endpoints, and home lab metrics from a different host on my trusted network.
- The metrics: My automation system fetches data from all around my home lab using simple Linux tools like df, glances and uptime, and makes them all available to the Raspberry Pi's script via a Flask app.
The code
The first configuration change goes in /etc/xdg/autostart/chromium.desktop and is meant to tell Chromium to run in kiosk mode, and to load a local file:
[Desktop Entry]
Type=Application
Name=Chromium
Exec=/usr/bin/chromium --disable-infobars --disable-session-crashed-bubble --kiosk file:///home/pi/scripts/status/index.html
I also installed the unclutter apt package to get rid of the mouse cursor and added the following to its configuration file at /etc/xdg/lxsession/LXDE-pi/autostart:
@unclutter -idle 0.1 -root
Then we have script.py which pulls 3 main data sources: news, weather and stocks. The sources are defined at the top of the script, and the rest of the code fetches the various endpoints and saves everything to data.js. It then gets run automatically every 15 minutes through a cron job:
#!/usr/bin/python3
# Fetch news, weather, and stock data for status screen. Outputs data.js.

from pathlib import Path
import warnings
warnings.filterwarnings('ignore', module='requests')
import feedparser
import connix
import json
import re
import html
import requests

folder = "/home/pi/scripts/status"

newsfeeds = [
    {"url": "https://globalnews.ca/world/feed/",       "category": "World"},
    {"url": "https://globalnews.ca/montreal/feed/",    "category": "Montreal"},
    {"url": "https://globalnews.ca/money/feed/",       "category": "Business"},
    {"url": "https://globalnews.ca/technology/feed/",  "category": "Technology",
     "fallback_url": "https://globalnews.ca/entertainment/feed/", "fallback_category": "Entertainment"},
]

symbols = [
    {"symbol": "^GSPC",    "name": "S&P 500"},
    {"symbol": "^IXIC",    "name": "NASDAQ"},
    {"symbol": "CADUSD=X", "name": "CAD/USD"},
    {"symbol": "CADJPY=X", "name": "CAD/JPY"},
]

weather_url = "https://weather.gc.ca/rss/weather/45.529_-73.562_e.xml"


def normalize_title(title):
    return re.sub(r"[^a-z0-9 ]", "", title.lower()).strip()


def strip_html(text):
    text = re.sub(r"<[^>]+>", " ", text)
    text = html.unescape(text)
    return re.sub(r"\s+", " ", text).strip()


def get_thumbnail(item):
    for mt in item.get("media_thumbnail", []):
        if mt.get("url"):
            return mt["url"]
    for mc in item.get("media_content", []):
        if mc.get("url") and "image" in mc.get("type", "image"):
            return mc["url"]
    for enc in item.get("enclosures", []):
        if enc.get("type", "").startswith("image/"):
            return enc.get("url", "")
    return ""


# News

print("* Getting news...")
seen_titles = set()
news_data = []

for feed in newsfeeds:
    items = []
    category = feed["category"]
    feeds_to_try = [(feed["url"], feed["category"])]
    if feed.get("fallback_url"):
        feeds_to_try.append((feed["fallback_url"], feed["fallback_category"]))

    for url, cat in feeds_to_try:
        try:
            rss = feedparser.parse(url)
            for item in rss["items"]:
                norm = normalize_title(item.get("title", ""))
                if norm in seen_titles or len(norm) < 3:
                    continue
                seen_titles.add(norm)
                desc = strip_html(item.get("description", ""))
                desc = connix.max_len(desc, 200)
                thumb = get_thumbnail(item)
                items.append({"title": item["title"].strip(), "desc": desc, "thumb": thumb})
                if len(items) >= 3:
                    break
            print(f"  {cat}: {len(items)} items")
            category = cat
            if items:
                break
        except Exception as e:
            print(f"  Error fetching {cat}: {e}")

    news_data.append({"category": category, "items": items})

# Weather

print("* Getting weather...")
weather_data = []
try:
    rss = feedparser.parse(weather_url)
    count = 0
    for item in rss["items"]:
        if item["tags"][0]["term"] == "Weather Forecasts" and "night:" not in item["title"]:
            t = item["title"].lower()
            if "thunder" in t or "storm" in t:
                icon = "fa-solid fa-cloud-bolt"
            elif "rain" in t or "shower" in t:
                icon = "fa-solid fa-cloud-rain"
            elif "snow" in t or "flurr" in t or "blizzard" in t:
                icon = "fa-solid fa-snowflake"
            elif "cloud" in t or "overcast" in t:
                icon = "fa-solid fa-cloud-sun"
            elif "wind" in t:
                icon = "fa-solid fa-wind"
            else:
                icon = "fa-solid fa-sun"
            parts = item["title"].split(":", 1)
            nums = re.findall(r"\b\d+(?!%)\b", parts[1]) if len(parts) > 1 else []
            if nums:
                temp = ("-" if "minus " in item["title"] else "") + nums[0]
            else:
                temp = "?"
            weather_data.append({"day": parts[0].strip(), "icon": icon, "temp": temp})
            count += 1
        if count >= 6:
            break
    print(f"  {len(weather_data)} days")
except Exception as e:
    print(f"  Error fetching weather: {e}")

# Stocks

print("* Getting stocks...")
stocks_data = []
for sym in symbols:
    try:
        url = f"https://query1.finance.yahoo.com/v8/finance/chart/{sym['symbol']}"
        r = requests.get(
            url,
            headers={"User-Agent": "Mozilla/5.0"},
            params={"interval": "1d", "range": "1d"},
            timeout=10,
        )
        meta = r.json()["chart"]["result"][0]["meta"]
        price = float(meta["regularMarketPrice"])
        prev = float(
            meta.get("previousClose")
            or meta.get("chartPreviousClose")
            or meta.get("regularMarketPreviousClose")
            or price
        )
        change_pct = ((price - prev) / prev) * 100
        price_str = f"{price:,.2f}"
        pct_str = f"{change_pct:+.2f}"
        stocks_data.append({"name": sym["name"], "price": price_str, "change_pct": pct_str})
        print(f"  {sym['name']}: {price_str} ({pct_str}%)")
    except Exception as e:
        print(f"  Error fetching {sym['symbol']}: {e}")
        stocks_data.append({"name": sym["name"], "price": "--", "change_pct": "0"})

# Write data.js

payload = json.dumps(
    {"news": news_data, "weather": weather_data, "stocks": stocks_data},
    ensure_ascii=False,
)
output = f"window.STATUS_DATA = {payload};\n"

tmp = f"/tmp/adusa_{connix.guid()}.js"
with open(tmp, "w", encoding="UTF-8") as fd:
    fd.write(output)

size = Path(tmp).stat().st_size
if size > 200:
    connix.cmd(f"mv {tmp} {folder}/data.js")
    print(f"* Wrote {folder}/data.js ({size} bytes)")
else:
    connix.cmd(f"rm -f {tmp}")
    print("* Output too small, not updating data.js")
Finally, the JavaScript code in index.html, the file that Chromium loads. It's meant to pull the data from data.js and the metrics provided by my automation system:
function pad(n) { return n < 10 ? '0' + n : '' + n; }
function esc(str) {
if (!str) return '';
return String(str)
.replace(/&/g, '&')
.replace(//g, '>')
.replace(/"/g, '"');
}
var rssVal = '--';
var errVal = '--';
var todayWeather = null;
function londonHour(now) {
var y = now.getUTCFullYear();
var bstStart = new Date(Date.UTC(y, 2, 31));
bstStart.setUTCDate(31 - bstStart.getUTCDay());
var bstEnd = new Date(Date.UTC(y, 9, 31));
bstEnd.setUTCDate(31 - bstEnd.getUTCDay());
return (now.getUTCHours() + (now >= bstStart && now < bstEnd ? 1 : 0)) % 24;
}
function updateClock() {
var now = new Date();
var days = ['Sun', 'Mon', 'Tue', 'Wed', 'Thu', 'Fri', 'Sat'];
var Y = now.getFullYear();
var M = pad(now.getMonth() + 1);
var D = pad(now.getDate());
var WD = days[now.getDay()];
var h = pad(now.getHours());
var m = pad(now.getMinutes());
var utc_m = pad(now.getUTCMinutes());
var london_h = pad(londonHour(now));
var tokyo_h = pad((now.getUTCHours() + 9) % 24);
document.getElementById('header-time').innerHTML =
" " + Y + '-' + M + '-' + D + ' (' + WD + ')' +
"MONTREAL " + h + ':' + m + "" +
"LONDON " + london_h + ':' + utc_m + "" +
"TOKYO " + tokyo_h + ':' + utc_m + "" +
" " + rssVal + "" +
" " + errVal + "";
}
function todayWeatherHtml() {
if (!todayWeather) return '';
return " " + esc(todayWeather.temp) + "°";
}
function reload_hwinfo() {
var xhttp = new XMLHttpRequest();
xhttp.open('GET', 'https://hwinfo.dendory.net/');
xhttp.timeout = 5000;
xhttp.onreadystatechange = function() {
if (this.readyState !== 4) return;
if (this.status !== 200) { showHwFallback(); return; }
try {
var data = JSON.parse(this.responseText);
var proxmox = (data.proxmox || '-- -- --').split(' ');
var temps = (data.temps || '-- -- --').split(' ');
var nodes = ['Firefly', 'Fauna', 'Rappa'];
var boxes = '';
for (var i = 0; i < 3; i++) {
boxes +=
"" +
"" + nodes[i] + "" +
" " + (proxmox[i] || '--') + " " +
" " + (temps[i] || '--') +
"";
}
rssVal = data.rss || '--';
errVal = data.errors || '--';
document.getElementById('header-hw').innerHTML =
" " + esc(data.disk || '--') + "" +
boxes +
todayWeatherHtml();
} catch(e) { showHwFallback(); }
};
xhttp.onerror = showHwFallback;
xhttp.ontimeout = showHwFallback;
xhttp.send();
}
function showHwFallback() {
var nodes = ['Firefly', 'Fauna', 'Rappa'];
var boxes = nodes.map(function(n) {
return "" + n + "-- --";
}).join('');
document.getElementById('header-hw').innerHTML =
" --" +
boxes +
todayWeatherHtml();
}
function renderStocks(data) {
var stocksHtml = '';
(data.stocks || []).forEach(function(s) {
var pct = parseFloat(s.change_pct);
var cls = pct > 0 ? 'pos' : (pct < 0 ? 'neg' : 'neu');
var arrow = pct > 0
? " "
: (pct < 0 ? " " : '');
stocksHtml +=
"" +
"" + esc(s.name) + "" +
"" + esc(s.price) + arrow + " (" + esc(s.change_pct) + "%)" +
"";
});
document.getElementById('stocks-row').innerHTML = stocksHtml || 'Stocks unavailable';
}
function renderNewsCol(col, index) {
var colEl = document.getElementById('news-col-' + index);
if (!colEl) return;
var h = "" + esc(col.category) + "";
(col.items || []).forEach(function(item) {
var titleLen = (item.title || '').length;
var descClamp = titleLen <= 34 ? 3 : (titleLen <= 69 ? 2 : 1);
var thumbHtml = item.thumb
? " + ") "
: "";
h +=
"" +
thumbHtml +
"" + esc(item.title) + "" +
"" + esc(item.desc) + "" +
"";
});
colEl.innerHTML = h;
}
function renderAllNews(data, staggerMs) {
(data.news || []).forEach(function(col, i) {
setTimeout(function() { renderNewsCol(col, i); }, i * staggerMs);
});
}
function render() {
var data = window.STATUS_DATA || {};
todayWeather = (data.weather || [])[0] || null;
renderStocks(data);
renderAllNews(data, 5000);
}
function refreshData() {
var s = document.createElement('script');
s.src = 'data.js?t=' + Date.now();
s.onload = function() {
var data = window.STATUS_DATA || {};
todayWeather = (data.weather || [])[0] || null;
renderStocks(data);
renderAllNews(data, 20000);
s.parentNode.removeChild(s);
};
document.head.appendChild(s);
}
// Init — render() first so todayWeather is set before reload_hwinfo() uses it
updateClock();
setInterval(updateClock, 1000);
render();
showHwFallback();
reload_hwinfo();
setInterval(reload_hwinfo, 60000);
setInterval(refreshData, 900000);
"
: "";
h +=
"" +
thumbHtml +
"" + esc(item.title) + "" +
"" + esc(item.desc) + "" +
"";
});
colEl.innerHTML = h;
}
function renderAllNews(data, staggerMs) {
(data.news || []).forEach(function(col, i) {
setTimeout(function() { renderNewsCol(col, i); }, i * staggerMs);
});
}
function render() {
var data = window.STATUS_DATA || {};
todayWeather = (data.weather || [])[0] || null;
renderStocks(data);
renderAllNews(data, 5000);
}
function refreshData() {
var s = document.createElement('script');
s.src = 'data.js?t=' + Date.now();
s.onload = function() {
var data = window.STATUS_DATA || {};
todayWeather = (data.weather || [])[0] || null;
renderStocks(data);
renderAllNews(data, 20000);
s.parentNode.removeChild(s);
};
document.head.appendChild(s);
}
// Init — render() first so todayWeather is set before reload_hwinfo() uses it
updateClock();
setInterval(updateClock, 1000);
render();
showHwFallback();
reload_hwinfo();
setInterval(reload_hwinfo, 60000);
setInterval(refreshData, 900000);
The code is fairly simple. First, there are a number of functions that render that various data points inside custom HTML tags. Then, all the reload functions ensure that each pane is refreshed on a regular basis, while avoiding the entire page reloading at once, since my Raspberry Pi is a fairly low powered device. Finally, while the Internet data is loaded from the local file, metrics are loaded directly from another host on my network, hwinfo.dendory.net. You could replace this with whatever makes sense for your use case.
At this point, it's important to mention that all of this can easily be done with AI. In fact, the latest UI redesign was done by Claude Code. But I think the interesting part is the overall design and flow of the system. It shows what can be done with a bit of imagination and some extra hardware. Hopefully it gave you some ideas of an interesting project that can be done over a weekend.